Making the Grade
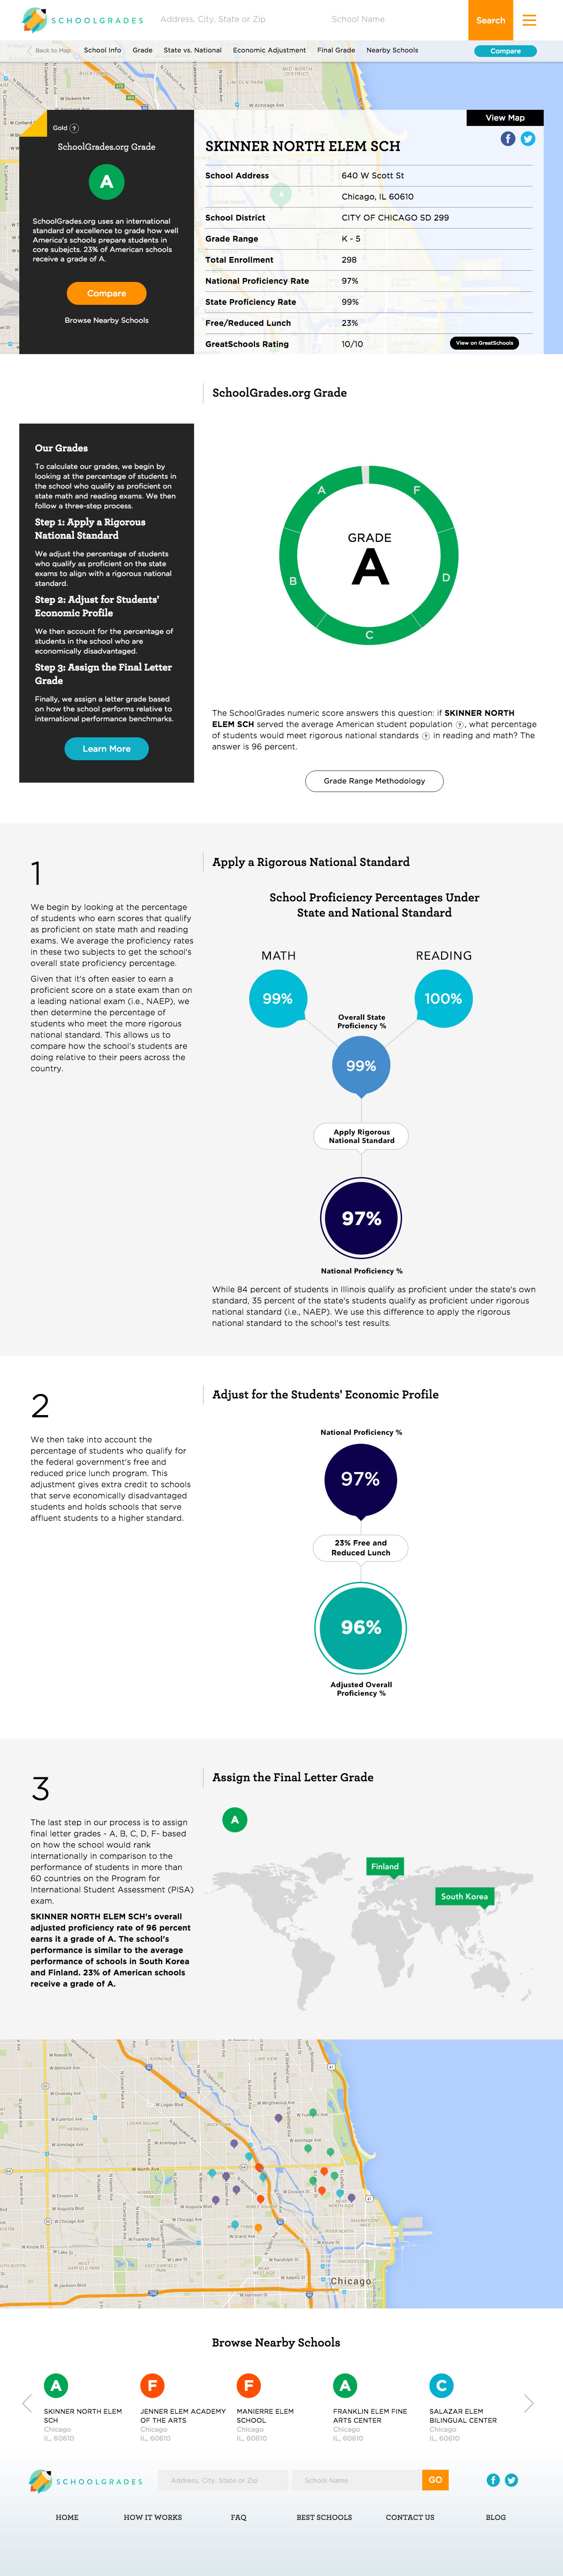
Making the data consumable by the average user boiled down to one core first step: a way to compare schools at a glance. After batting around a few ideas, we settled on a system that kept with the educational messaging of the project: grade the schools A-F based on the Manhattan Institute and Arnold Foundation’s model. We’d also reward schools that scored particularly highly in the model with Honors status (gold, silver or bronze), and honors schools with 50% or more of their student population eligible for free and/or reduced lunch would be All-American schools (as they were able to achieve highly with a less affluent student body).
The next step was to build a backend that could store all the data and retrieve it at a moment’s notice. We built a powerful API and connected it to a robust search to allow users to find schools not only by address and school name, but also by current location or filter their results down to their specific needs.
We also created a comparison tool that allows users to save schools to a “cart” and view them side-by-side. One of the goals of the project was to encourage users to compare schools, so we added suggestions to compare all over the website and a persistent bar that allows you to track the schools you’re comparing and compare apples to apples.
From there, we set out to make the complicated methodology behind the grade easy to understand and beautiful to look at. We made charts and graphs. We designed a logo. We organized the methodology into steps and added tooltips when necessary. We revised sentences over and over until they became easy to understand and statistically accurate. And of course, we designed it look great on all devices.
The result is a site that looks beautiful and works smoothly, but doesn’t dumb the complex methodology down. Instead, it encourages users to be as informed as possible and gives them the tools to make good decisions about their children’s futures, learn more about their district’s achievement level, and/or investigate the state of American schools as a whole.